Phase 7: Monitoring & Observability in DevOps – Complete Practical Guide (2026)
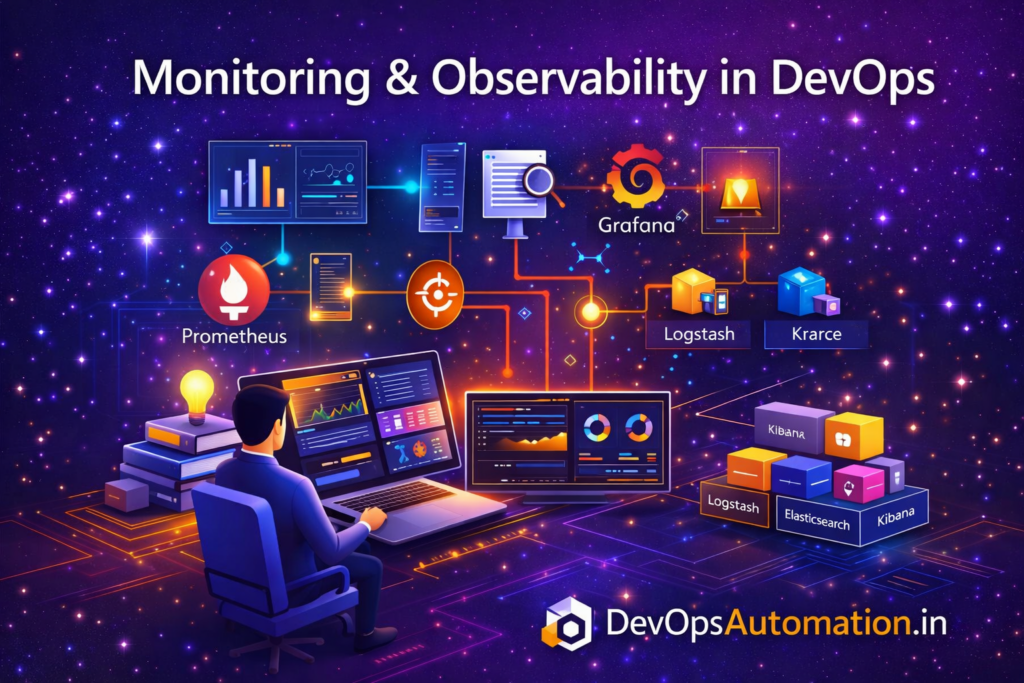
? Monitoring & Observability in DevOps
Monitoring & Observability in DevOps is a critical phase in the DevOps Roadmap 2026.
Once applications are deployed using containers and Kubernetes, DevOps teams must continuously monitor system health, performance, and reliability to ensure stable production systems.
Without proper monitoring and observability, teams operate blindly, detect issues late, and react only after failures impact users.
Effective monitoring allows DevOps teams to move from reactive firefighting to proactive system management.

What Is Monitoring in DevOps?
Monitoring in DevOps focuses on collecting and analyzing system data to understand the current state of applications and infrastructure.
Monitoring typically answers questions such as:
- Is the application running?
- Is CPU or memory usage high?
- Are error rates increasing?
- Is latency within acceptable limits?
Monitoring relies heavily on metrics and alerts to detect abnormal behavior early and notify teams before incidents escalate.
What Is Observability in DevOps?
Observability goes beyond traditional monitoring.
Monitoring & Observability in DevOps emphasizes understanding why a system behaves a certain way, not just what is happening at a surface level.
Observability allows DevOps engineers to explore system behavior dynamically, especially in complex microservices-based architectures where failures are harder to predict.
? Monitoring vs Observability (Simple Human Explanation)
Many beginners confuse monitoring and observability. While they work together, they solve different problems.
Monitoring tells you what is wrong.
It answers questions like:
- CPU usage is high.
- Error rate increased.
- A service is down.
- Response time is slow.
Monitoring is considered reactive. It alerts you after something crosses a threshold.
Observability tells you why it is wrong.
It helps you investigate:
- Which service caused the slowdown?
- Which database query failed?
- Where the latency started?
- How requests flow between services?
Observability allows engineers to explore unknown problems instead of only known metrics.
Think of it like this:
- Monitoring is your dashboard warning light.
- Observability is the mechanic tools that help you diagnose the engine.
Modern DevOps teams use both together to maintain stable production systems.
This combination makes Monitoring & Observability in DevOps far more powerful than traditional monitoring alone.
Monitoring & Observability in DevOps – Core Pillars
Observability is built on three fundamental pillars that work together to provide deep system visibility.
? Metrics
Metrics are numerical measurements such as:
- CPU usage
- Memory consumption
- Request latency
- Error rates
Metrics help DevOps teams identify performance degradation trends and capacity issues before they impact users.
? Logs
Logs provide detailed, time-stamped records of events generated by applications and infrastructure.
Logs are useful for:
- Debugging failures
- Investigating incidents
- Auditing system behavior
- Understanding application flow
? Traces
Traces track a single request as it flows through multiple services and components.
Tracing is critical for:
- Microservices architectures
- Identifying performance bottlenecks
- Understanding service dependencies
Together, metrics, logs, and traces form the foundation of Monitoring & Observability in DevOps.
? How Metrics, Logs, and Traces Work Together in Real Life
In real production environments, metrics, logs, and traces complement each other instead of working independently.
Imagine this scenario:
Your monitoring dashboard shows a sudden spike in response time for an API. This metric alerts your team that something is wrong.
Next, you check application logs to see error messages, timeouts, or failed database calls. Logs provide detailed clues about what happened internally.
If the system uses distributed tracing, you trace a slow request across microservices. The trace reveals that one downstream service is causing delays due to high database latency.
This layered approach helps DevOps engineers move from detection to diagnosis quickly.
Metrics help you notice problems.
Logs help you understand symptoms.
Traces help you find the root cause.
This workflow is a practical example of how Monitoring & Observability in DevOps reduces downtime and speeds up incident resolution.
Popular Monitoring & Observability Tools
DevOps teams use a combination of open-source and managed tools to implement monitoring and observability.
? Prometheus
- Metrics-based monitoring system
- Pull-based data collection
- Widely used in Kubernetes environments
? Grafana
- Visualization and dashboarding platform
- Works seamlessly with Prometheus and other data sources
? ELK Stack
- Elasticsearch
- Logstash
- Kibana
Used for centralized logging and log analysis.
? Tool choice is less important than understanding monitoring and observability concepts.
Alerting and Incident Detection
Alerts notify DevOps teams when predefined thresholds are breached or anomalies are detected.
Effective alerting should be:
- Actionable
- Meaningful
- Noise-free
Poorly designed alerts lead to alert fatigue, while well-designed alerts enable faster incident response and reduce downtime.
?? Managed vs Open-Source Monitoring Tools
DevOps teams usually choose between open-source tools and managed monitoring platforms.
Open-source tools like Prometheus, Grafana, and ELK provide:
- Full control and customization
- No licensing costs
- Strong community support
- Flexibility for complex environments
However, they require maintenance, upgrades, scaling, and backup management.
Managed tools such as Datadog, New Relic, and CloudWatch offer:
- Minimal setup and maintenance
- Built-in scaling
- Simplified integrations
- Faster onboarding for teams
The trade-off is higher cost and reduced customization.
Many organizations use a hybrid approach:
Open-source for core infrastructure monitoring and managed tools for business-critical applications.
Choosing the right tool depends on:
- Team size
- Budget
- Operational maturity
- Compliance requirements
Understanding tool trade-offs is part of mastering Monitoring & Observability in DevOps.
Monitoring & Observability in Production Environments
In real-world DevOps environments:
- Metrics are collected continuously
- Dashboards visualize system health
- Alerts trigger incident response
- Logs and traces help diagnose issues
- Root cause analysis prevents recurrence
This proactive approach is the true value of Monitoring & Observability in DevOps, helping teams maintain reliable and scalable systems.
Monitoring & Observability in DevOps helps teams understand system behavior, detect issues early, and maintain application reliability in production environments.
Monitoring & Observability in DevOps is essential for running scalable and stable DevOps systems.
? Real Production Incident Example – How Observability Saves Time
Consider a real-world production scenario.
An e-commerce website suddenly experiences slow checkout performance during peak traffic hours.
The monitoring system alerts the DevOps team that response time has crossed the threshold. CPU and memory usage look normal, so infrastructure does not appear overloaded.
Engineers analyze application logs and find intermittent database timeout errors.
Using distributed tracing, they trace slow requests across microservices and discover that a payment service is making slow external API calls.
The root cause turns out to be a network latency issue with a third-party provider.
Without observability, the team might have spent hours guessing and restarting services blindly.
With proper Monitoring & Observability in DevOps, the team identifies the exact bottleneck within minutes and applies a workaround.
This example highlights how observability directly improves incident response speed and business reliability.
SRE Practices and Observability
Monitoring & observability are closely linked to Site Reliability Engineering (SRE) practices.
Key SRE concepts include:
- SLIs (Service Level Indicators)
- SLOs (Service Level Objectives)
- Error budgets
These practices help teams balance system reliability with development velocity and business goals.
? SLIs, SLOs, and Error Budgets (Simple Explanation)
Site Reliability Engineering (SRE) introduces measurable reliability targets.
SLI (Service Level Indicator)
A metric that measures system performance, such as:
- Availability percentage
- Response time
- Error rate
SLO (Service Level Objective)
The target goal for an SLI.
Example:
99.9% uptime per month.
Error Budget
The acceptable amount of failure allowed while still meeting the SLO.
Error budgets help teams balance innovation and stability.
If the error budget is consumed quickly, teams focus on reliability improvements instead of releasing new features.
Monitoring provides the data needed to calculate SLIs and track SLO compliance.
This tight integration between SRE and Monitoring & Observability in DevOps ensures business objectives align with engineering reliability.
Common Beginner Mistakes
? Monitoring only infrastructure and ignoring applications
? Creating too many alerts
? Not using dashboards
? Ignoring logs and traces
Avoiding these mistakes makes monitoring effective, scalable, and sustainable in production systems.
How Phase 7 Fits into the DevOps Roadmap 2026
Monitoring & Observability in DevOps connects multiple DevOps phases:
- Containers & Kubernetes (Phase 6)
- CI/CD Automation (Phase 4)
- Production Support (Phase 8)
Monitoring ensures DevOps systems remain reliable after deployment, not just during development.
What’s Next After Monitoring & Observability?
Once systems are observable, the final step is handling real production incidents and preparing for DevOps interviews.
? Phase 8: Producti